Ways to conserve energy in compressed air systems
Ways to conserve energy in a plant often start with compressed air, because it is one of the most expensive utilities per kWh delivered to the point of use. The problem is not a lack of ideas. It is a lack of trustworthy data and time to prove savings. This guide shows a simple, repeatable method: measure flow, pressure, power, temperature, and dew point, then act on the biggest losses first using energy monitoring.
You will also see how to translate measurements into finance-ready numbers for ISO 50001 (Energy Management System, EnMS) reporting. Expect realistic improvement potential of 10–20% from better control and maintenance. In many plants the total savings opportunity can be larger when leaks and misuse are high, but you should validate this with measurements before committing to projects.
Ways to conserve energy: why compressed air is a top target
Compressed air waste hides in plain sight. A small leak runs 24/7. A 0.5 bar(g) pressure increase looks harmless. Yet both can add thousands of kWh per year. Because compressed air is generated centrally and used everywhere, small problems multiply across the network.
For most industrial sites, the fastest payback actions fall into three buckets. First, reduce demand (leaks and inappropriate use). Second, reduce system pressure losses (pressure drop and poor regulation). Third, improve compressor operation (load/unload behaviour and sequencing). You cannot prioritise these without measuring both flow and power at the same time.
From a compliance angle, ISO 50001 needs a baseline, defined energy performance indicators (EnPIs), and ongoing verification. A one-off audit helps, but persistent monitoring makes savings stick. It also reduces firefighting because you can see abnormal consumption before it becomes a production issue.
How to measure what matters (and where to place sensors)
To quantify savings, measure different parameters in your plant: flow, pressure, temperature, power and dew point.
For insight in consumption demand, start with one flow measurement location that represents the whole system: the main header after the compressors and treatment, before major branches. If your plant has multiple production halls, add sub-meters on the largest branches. That enables cost allocation and helps you find which area drives base load outside production hours.
Use a flow meter that matches your pipe and application. Thermal mass flow meters are often the simplest for audits and permanent points because they measure mass flow directly and report Nm³/h without needing additional pressure and temperature compensation. For selection and installation considerations, review the available flow meters and match the meter type to pipe size, expected range, and installation constraints.
Power measurement is mandatory if you want verified kWh/Nm³. Install a 3-phase power meter on each compressor to measure its power consumption. Use 4-in-1 flow meters at the discharge of the compressor, so you are measuring also pressure, temperature and total flow, beside flow consumption. Add additional pressure sensors at critical points of use to quantify pressure drop across filters, dryers, and distribution. Using a 4-in-1 flow meter here also allows you to track performance issues related to temperature or flow, besides pressure.
Dew point (the temperature at which water vapour condenses) is a quality KPI. Poor dryer performance increases pressure drop, corrosion risk, and product quality issues. Place dew point measurement after the dryer and, if needed, near critical processes.
A step-by-step plan you can run with a small team
Step 1: Start an audit and install instruments in key locations. Confirm correct pipe diameter entry, flow direction, and straight pipe requirements. Validate signals by comparing expected compressor capacity to measured peak flow. Check that power meters read realistic kW in loaded and unloaded states. Log all data in data logger(s), preferably one that immediately ads the right time stamp with all data entries for proper data analyses.
Step 2: Set the baseline. Log at least 7 days, including weekends, to capture low-load periods. Record production schedule, shift patterns, and major consumers. Baseline KPIs should include total flow (Nm³/h), average header pressure (bar(g)), compressor power (kW), and total energy (kWh).
Step 3: Analyse the data and start with improving your compressed air system, starting with highest ROI items first.
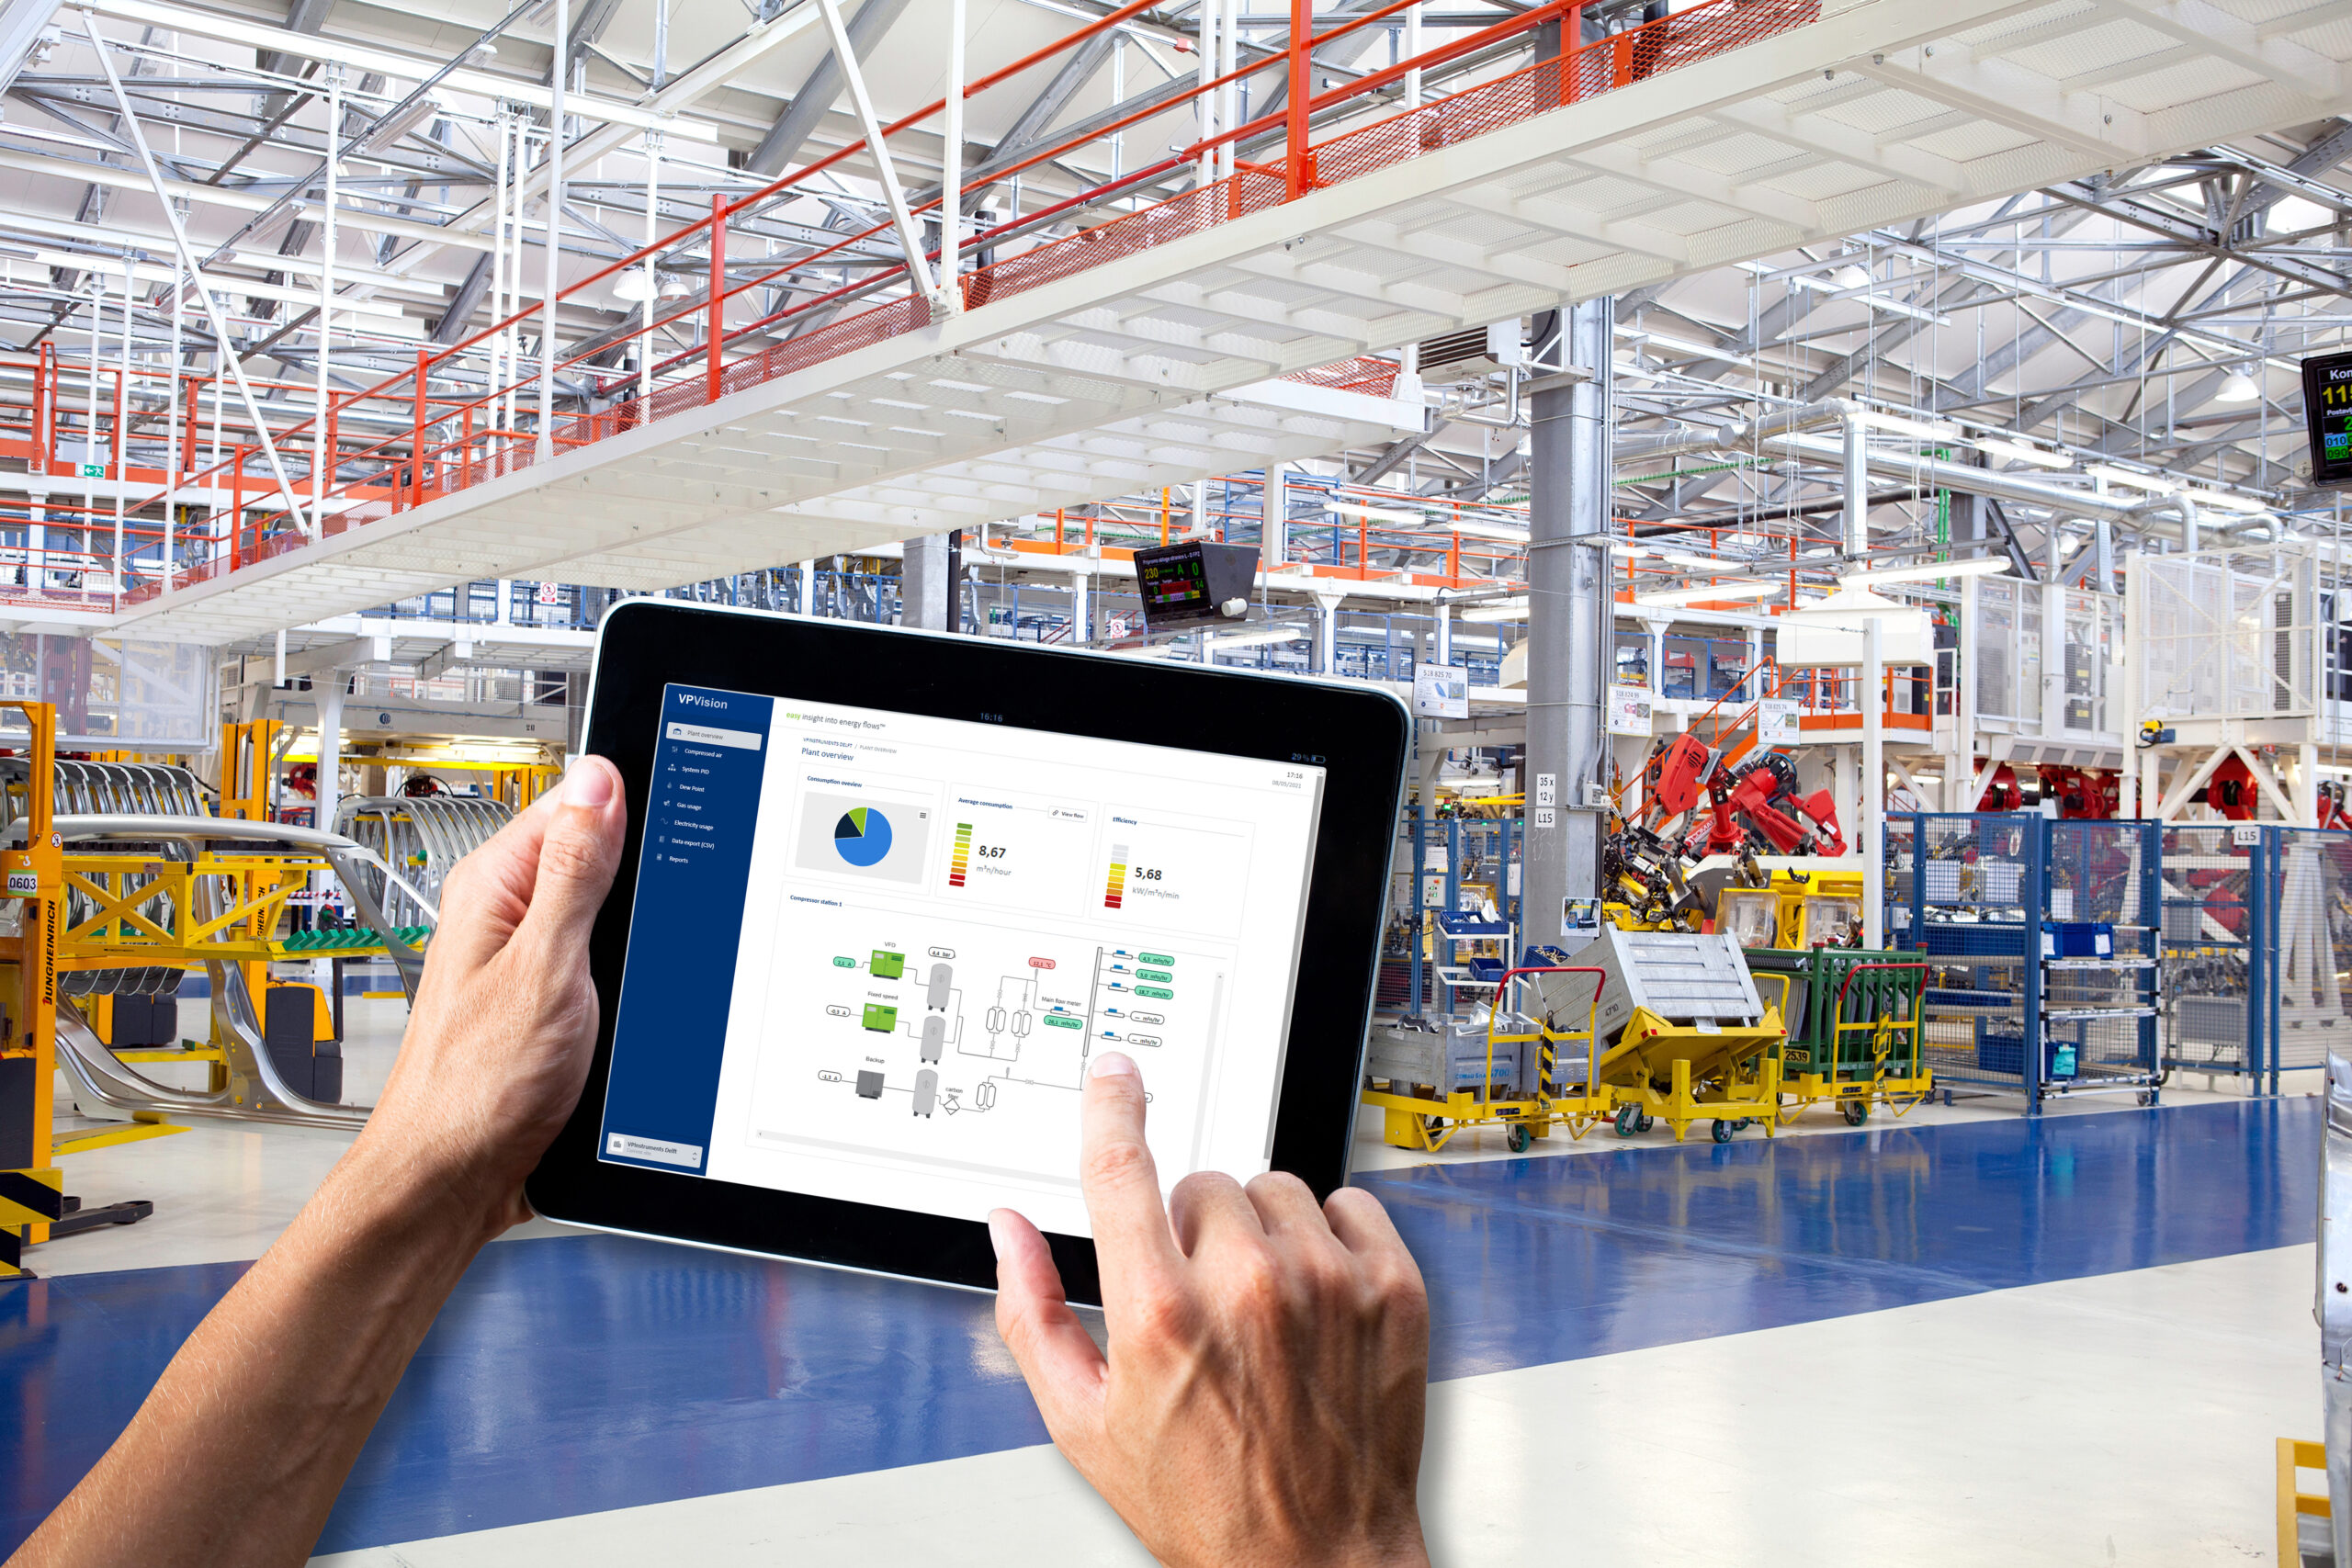
Step 4: Leave the instrumentation for permanent use, add instruments if you want more granular insights in certain areas. Centralise data and add context. Use monitoring software such as VPVision to trend flow, pressure, and power on one timeline. Add tags for production states. This step is where you convert raw measurements into decisions.
Step 5: Analyse losses and rank actions by ROI. Compare nights and weekends to production hours. High off-hour flow indicates leaks, open blow-offs, or uncontrolled purge air. Compare kW to flow to see inefficient compressor operation, such as long unload periods or short cycling.
Step 6: Implement actions. Fix leaks, remove inappropriate uses, set pressure bands, service filters and drains, and adjust compressor sequencing. Change one thing at a time when possible, so you can verify impact.
Step 7: Review and lock in gains. Recalculate kWh/Nm³ and cost after each change. Then set alarms for drift, such as rising base load or increasing pressure drop. Persistent monitoring prevents old habits from returning.
Quick checklist: five actions that usually pay back first
- Reduce base load by fixing leaks and stopping non-productive air use during shutdowns.
- Lower header pressure in small steps while protecting critical points of use.
- Cut pressure drop by maintaining filters, dryers, and separators before they choke the network.
- Improve compressor control by reducing unload time and avoiding short cycling.
- Verify dryer performance with dew point and avoid unnecessary purge losses.
Worked example: from Nm³/h to euros saved
Assume your monitoring shows an off-hour base load of 300 Nm³/h at 7.0 bar(g). Production is stopped 4,000 h per year (nights and weekends). You measure compressor power during these periods at 55 kW. This is your non-productive energy baseline.
If you run a leak and misuse campaign and cut base load by 30%, the flow reduction is 90 Nm³/h. If power drops proportionally (verify with measurements), you save about 0.30 × 55 kW = 16.5 kW during off-hours. Annual energy saved is 16.5 kW × 4,000 h = 66,000 kWh.
To translate to cost, multiply by your electricity price. At €0.07/kWh, this is €4,620 per year. If your total project cost for detection, repairs, and verification is €4,000, payback is about 1 years. The stronger argument for management is risk reduction too: lower leakage base load increases available capacity, which can prevent pressure dips and unplanned downtime.
Now add pressure optimisation. If you reduce header pressure from 7.0 to 6.5 bar(g) without quality issues, you often reduce system demand and compressor power. Each bar pressure reduction saves 1% of energy savings. Do this only with data from both pressure and the most sensitive points of use. Validate the new pressure band over at least one full production week.
KPIs to keep savings permanent
Track a small set of KPIs that connect engineering changes to money and uptime. Specific energy (kWh/Nm³) is the primary EnPI for compressed air efficiency. It shows whether your system is improving, independent of production volume.
Also track base load (Nm³/h) during non-production. Express it as a percentage of average production flow to keep it understandable. Measure pressure drop between compressor room and the critical point of use in bar(g). Rising pressure drop is an early warning of clogged filters, undersized piping, or dryer issues.
For compressor behaviour, trend load/unload percentage and start/stop events. Too many starts indicate poor control or insufficient storage. Finally, track dew point in °C to ensure air quality remains stable.
Conclusion: The most reliable ways to conserve energy in compressed air are measurement-led. Start by capturing a baseline. Then reduce base load, pressure drop, and poor compressor control. Verify every change in kWh/Nm³ so you can defend results in euros and keep ISO 50001 documentation clean.
If you want a fast start, review your metering points and select the right instruments for each line. Then Book a Demo to see how VPVision turns flow and power data into actions you can report and repeat.
Where should I place the main flow meter?
Place it in the main header after compressors and treatment, before large branches. This gives a single source of truth for total demand.
Can I install flow sensors under pressure?
Yes, you can for insertion type flow meters. You can make an installation point using a hot tap drill and hot tap saddles. Use a ball valve to insert your flow meter in the compressed air line. Safety first! Get the proper training to work with hot tapping, so you are taking the appropriate safety measures into account when working with compressed air.
Do I need both mass flow and volumetric flow?
It is advised to use flow meters that can give output in mass flow. It normalises to standard conditions and makes comparison of flow data between instruments and with compressor output easy.
How do I integrate with PLC/SCADA?
Use standard industrial communications (for example Modbus) and log to a central platform for trending and reporting. Integration is most valuable when you add production state signals.
 中国 (简体中文)
 UK (English)